• Home
  • New to RX Wealth? Start Here
  • About
    • About
    • Who We Serve
    • Rx Wealth Plan
    • How We Do It
    • Physician Wealth Management Framework
  • Insights
  • Clients
  • Contact
  • Skip to main content
  • Skip to footer
Rx Wealth Advisors

Rx Wealth Advisors

Physician-Focused Firm

New to RX Wealth? Start Here

  • Home
  • About
    • Who We Serve
    • Rx Wealth Plan
    • How We Do It
    • Physician Wealth Management Framework
  • Insights
  • Clients
  • Contact

Investments

Understanding Emotions During Volatile Markets

December 4, 2022 by crystal

Anger is a helpful emotion. We are angry when we see a person abused, and that anger compels us to intervene, helping the abused. But anger can be harmful when it compels us to say what we will soon regret, such as insulting a friend.

We cannot learn to eliminate anger, but we can learn to control it through cognitive reflection. We can follow our parents’ advice: “Count till 10 when you are angry before you speak.” 

Fear and Hope

Fear is also a useful emotion. Fear causes us to slam on the brakes when the car in front of us suddenly stops. But fear can be harmful when it’s exaggerated. For example, when stock prices slump, fear can magnify perceived risk and compel us to abandon our stock allocation. 

Financial advisers can reassure clients by teaching cognitive reflection, reminding them that high stock prices may go down and low stock prices may go up.   

Stock market declines induce fear. Days of substantial stock market declines are also days of significant increases in hospital admissions, especially for fear-related conditions like anxiety and panic disorder. [1]

High stock returns are associated with better mental health, whereas high volatility of returns is associated with poorer mental health. [2] Fear induced by earthquakes also increases the probability that people assign to stock market crashes. [3]

Fear increases risk aversion even among investment professionals, leading to high risk aversion in financial busts and low risk aversion in booms. Investment professionals asked to read a story about a financial bust became more fearful than those asked to read a story about a boom, and fear led them to reduce risky investments. [4]

Fearful investors often fly to safety, switching from risky investments to safer ones. The VIX Index is a risk gauge also known as the fear index. It measures expectations of future risk by expectations of future volatility of stock returns. Flight-to-safety episodes coincide with increases in the VIX, bearish consumer sentiment and bond returns that have often exceeded stock returns. [5]

A financial adviser described clients who asked her to sell all their stocks in 2008 and 2009 after the stock market crash, yet reversed themselves in 2014 by asking her to buy stocks after the stock market recovered. “It’s an emotional reaction,” she said. “[The years] 2008 and 2009 were like being in the fetal position. Now in 2014, everyone wants to buy.” [6]

Fearful investors expect low returns with high risk, whereas hopeful investors expect high returns with low risk. Brokerage records and matching monthly surveys show that high past returns are associated with increased return expectations, decreased risk perceptions and risk aversion. [7] A Gallup survey of investors asked: “Do you think that now is a good time to invest in the financial markets?” 

Figure 1 shows that recent high returns are followed by high percentages of investors who think now is a good time to invest. For example, 78% of investors answered “yes” in the exuberant days of February 2000 after major stock gains. Yet only 41% answered yes in the fearful days of March 2003 after major stock losses. Gallup also asked investors if they believe the market is overvalued or undervalued.

Figure 1: Investors Think Periods Following High Stock Returns Are Good Times to Invest in Financial Markets 

Figure 1: Investors Think Periods Following High Stock Returns Are Good Times to Invest in Financial Markets 

Figure 2 shows that months when large proportions of investors believe the stock market is overvalued are also months when they think now is a good time to invest in the financial markets. These beliefs are consistent with the intuitive system we know as System 1 but inconsistent with the reflective System 2, in which a belief that the stock market is overvalued accompanies a view that now is not a good time to invest.

Figure 2: Investors Think Periods When the Stock Market Is Overvalued Are Good Times to Invest in Financial Markets

Figure 2: Investors Think Periods When the Stock Market Is Overvalued Are Good Times to Invest in Financial Markets

How Fear Can Fuel Risk Aversion

Links between fear and risk aversion have been uncovered in many experiments. Consider the cash-out experiment, lasting 25 rounds. You begin with $10 in a stock whose price can go up or down in each round. 

After the stock’s current price is displayed, you can choose to play the next round or cash out by selling the stock at its current price. If you cash out at the start of the game, you keep your $10. If you play one or more rounds, you keep the amount of the price of the stock at the end of the last round you play. How many rounds would you play? 

Video clips showing scenes from two horror movies, The Sixth Sense and The Ring, induced fear in one group of people playing the cash-out game. People in a control group saw scenes from two benign documentaries about Benjamin Franklin and Vincent Van Gogh. Fear led to an early sell-off of the stock. This emotion is also contagious — fearful people sold especially early when they believed others shared their fear. [8] 

People in another experiment saw a clip from Hostel, another horror movie, showing a man tortured in a dark basement. Increased risk aversion was evident among the people who watched the clip but not among those who reported enjoying horror movies.

The experiment complements surveys among clients of an Italian bank before the financial crisis in 2007 and when the crisis was vivid in mid-2009. Risk aversion was measured qualitatively by asking clients about their willingness to take risks and quantitatively by asking them to specify the specific amounts that would persuade them to forego a 50-50 chance of winning 5,000 euros. 

Both measures indicated higher risk aversion in the crisis period than in the pre-crisis period, and these measures are consistent with actual changes in the portfolios of the bank’s clients. [9]

Financial advisers are teachers. They encourage and teach clients to examine emotions with cognitive reflection. When stock prices are high, they remind clients that the prices can go down. And when stock prices are low, they are rewarded by their clients’ calm in the knowledge that prices will likely go up.


Sources: 

  1. Joseph Engelberg and Christopher A. Parsons, “Worrying About the Stock Market: Evidence from Hospital Admissions,” Journal of Finance 71 (2016): 1227-1250.
  2. Anita Ratcliffe and Karl Taylor, “Who Cares About Stock Market Booms and Busts? Evidence from Data on Mental Health.”  IZA Discussion Paper No. 6956 (October 2012).
  3. William N. Goetzmann, Dasol Kim, and Robert J. Shiller, “Crash Beliefs from Investor Surveys,” (March 19, 2016). Available at SSRN. 
  4. Alain Cohn, Jan Engelmann, Ernst Fehr, and Michel André Maréchal, “Evidence for Countercyclical Risk Aversion: An Experiment with Financial Professionals.” American Economic Review 105, no. 2 (2015): 860-885. 
  5. Lieven Baele, Geert Bekaert, Koen Inghelbrecht, and Min Wei. “Flights to Safety,” NBER Working Paper No. w19095 (May 2013).
  6. Joe Light, “Retirement Investors Flock Back to Stocks,” The Wall Street Journal, May 1, 2014.
  7. Arvid O. I. Hoffmann and Thomas Post, “What Makes Investors Optimistic, What Makes Them Afraid?” Netspar Discussion Paper No. 11/2012-044 (March 2012).. 
  8. Chan Jean Lee and Eduardo B. Andrade, “Fear, Social Projection, and Financial Decision Making,” Journal of Marketing Research 48, no. SPL (November 2011): S121-S129.
  9. Luigi Guiso, Paola Sapienza, and Luigi Zingales, “Time Varying Risk Aversion,” NBER Working Paper No. 19284 (August 2013).

Data from 6/30/1998 – 12/31/2007. Source: Gallup.

Rx Wealth Advisors is a physician-focused financial advisory firm. Their primary focus is to help medical doctors maximize their earnings, keep more money in their pocket, and cultivate wealth so they can live the life they’ve earned and deserve. Rx Wealth can be reached at 412-227-9007, via email at croe@rxwealthadvisors.com, or on the web at rxwealthadvisors.com.

The opinions voiced in this material are for general information only and are not intended to provide specific advice or recommendations for any individual.

This material was prepared by Avantis Investors, and does not necessarily represent the views of the presenting party, nor their affiliates. This information has been derived from sources believed to be accurate and is intended merely for educational purposes, not as advice.

Investing Through Tough Times

November 28, 2022 by crystal

The U.S. stock market continues to record losses in 2022, and the U.S. economy shows signs that we are either in or may soon face a recession. Four charts help illustrate why we think sticking with stocks through tough times is still likely the better path forward for investors than jumping in and out of the market.

What Does a Recession Mean for Stock Returns?

While not official, there’s reason to believe the U.S. is currently in a recession. Two consecutive quarters of negative gross domestic product (GDP) growth are already in the books — a commonly cited barometer for recessions. 

The National Bureau of Economic Research (NBER) makes the official call, which typically comes many months after a recession actually begins. The NBER definition includes more than GDP declines (e.g., unemployment). Despite having to wait for its version of the assessment, the market is pricing a slowdown in the economy. 

For argument’s sake, let’s assume we are currently in a recession. What has that meant historically for U.S. stock returns? To explore this question, we measured returns during business cycles over the past 50 years. 

NBER defines a business cycle as the period from one economic peak to the next. Between two economic peaks is a recessionary period (where the economy contracts, or a peak-to-trough period) characterized by a decline in economic activity and an expansionary period (trough to peak) characterized by increasing economic growth.

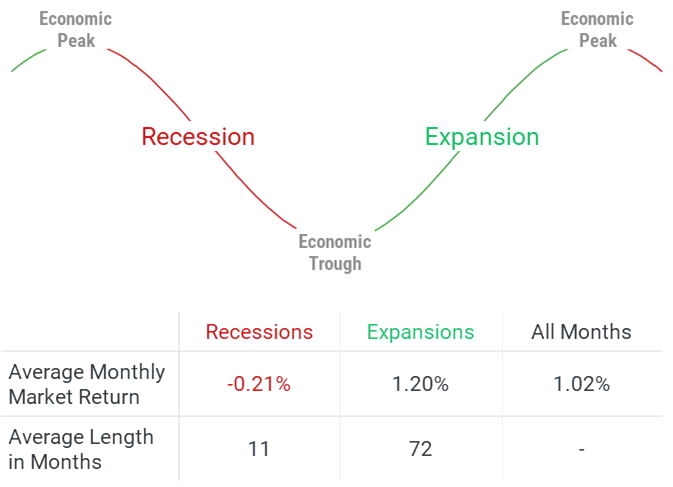
Our results are presented in Figure 1. We observe that the average monthly return of the U.S. market during all months, whether in recession or expansion, is just over 1% or about 12% per year. During recessions, returns have historically been slightly negative and well below the average across all months. Returns during periods of expansion have historically been positive and, at 1.20% per month, slightly above average stock returns across all months. 

Figure 1 | U.S. Stocks Have Historically Underperformed in Recessions, But the Economy Is More Often in Expansion

Figure 1 | U.S. Stocks Have Historically Underperformed in Recessions, But the Economy Is More Often in Expansion

At first glance, these results may not seem encouraging in the current economic environment, but there’s more to the story. First, it’s important to consider that the U.S. economy has historically experienced growth far more often than decline. The seven recessions over the past 50 years each lasted on average around 11 months, while each expansion lasted on average about 72 months.

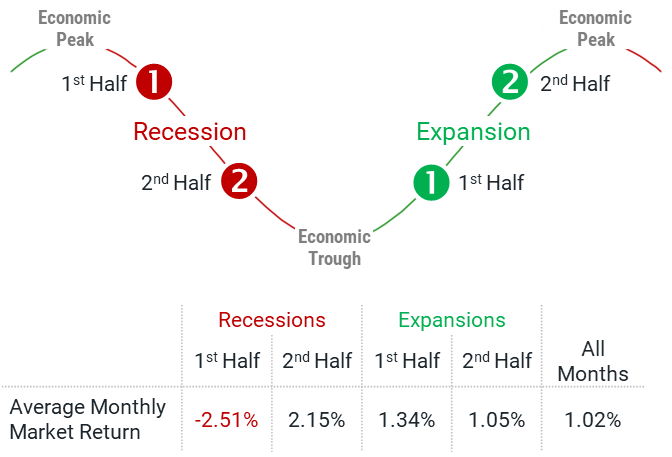
A deeper look at the returns during recessions reveals another interesting insight. In Figure 2, we divide recessionary and expansionary periods in half and present average monthly returns over these subperiods. 

Figure 2 | U.S. Stocks Have Enjoyed Strongly Positive Returns in the Second Half of Recessions

Figure 2 | U.S. Stocks Have Enjoyed Strongly Positive Returns in the Second Half of Recessions

What stands out is that the below-average returns we’ve seen historically during times of recession have been driven by significantly negative returns during the first half of the recession. In the second half of recessions, returns have been strongly positive and far above the average monthly return. Good times have historically continued during the first and second halves of expansions. 

What do these returns tell us? In the first half of recessions, markets react quickly to possible bad news. Expectations of lower company earnings during an economic slowdown and, more importantly, lower risk appetite due to increasing uncertainty, for example, are quickly reflected in lower stock prices. 

The lower risk appetite is reflected in investors increasing their demanded discount rates [1]—their expected return—for investing in risky assets (i.e., equities). That increase in discount rates for future cash flows produces a drop in prices. But, as bad news dissipates and uncertainty subsides, the market also incorporates these improving expectations. 

It would be great if we could get out of the market at the start of a recession before stocks typically experience a downturn and then get back in as prices go back up. The issue is that we can’t say with certainty when economic peaks and troughs will start and end until after the fact — and trying to time these events can have detrimental effects on investors if they get it wrong. 

Considering where we are today, we’ve already seen U.S. stocks decline significantly. We can’t know for sure, but it may be that we are currently experiencing the disappointing returns often seen during the first half of recessions. The market seems to have already priced in a lot of bad news and the potential for turmoil. 

The risk of fleeing the market today is that investors may leave when the bad news is priced in and miss out on the historically positive returns typically seen in the second half of recessions. 

What Has Recession Meant for Small Value-Focused Investors?

Investors may also wonder how stocks with different characteristics or in different asset classes perform throughout business cycles to understand how a particular focus in their portfolios might affect outcomes during and after recessions.

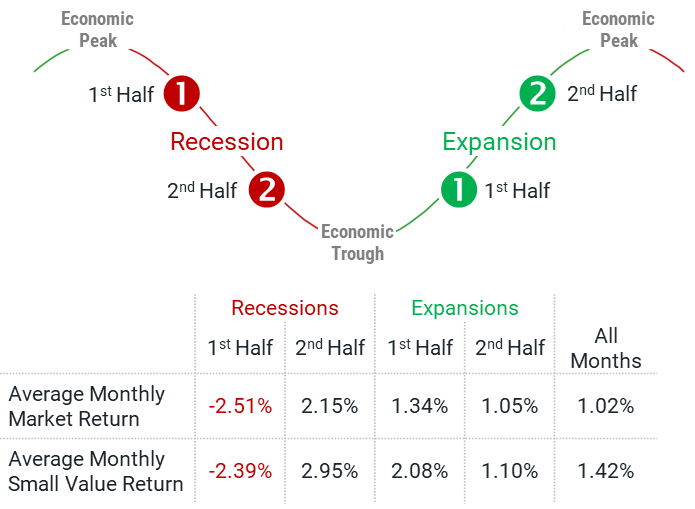
We find that a focus on companies with lower valuations has historically fared better than the market over the long term, but the difference has been especially meaningful following the poor returns historically exhibited during the first half of recessions.

Figure 3 | Lower-Priced Stocks Have Historically Fared Better Than the Market in Recessions and Expansions

Figure 3 | Lower-Priced Stocks Have Historically Fared Better Than the Market in Recessions and Expansions

In Figure 3, we show the returns of traditional value (low price-to-book) stocks within small caps during the business cycle periods shown in Figures 1 and 2. We see that small-value stocks have exhibited higher returns than the market, dating back to 1973. Over the first half of recessions, when we have historically seen sharply negative returns for U.S. stocks, small-value stocks declined to a lesser degree than the total market.

Over the second half of recessions and during the first and second halves of expansions, small-value stocks again outperformed the market during each period. Notably, the returns for small-value stocks have, on average, been much higher than the market in the second half of recessions and the first half of expansions.

This tells us that valuations matter whether the economy expands or contracts. In the periods following the first half of historical recessions, valuations have mattered quite a lot.

Don’t Lose Sight of the Destination

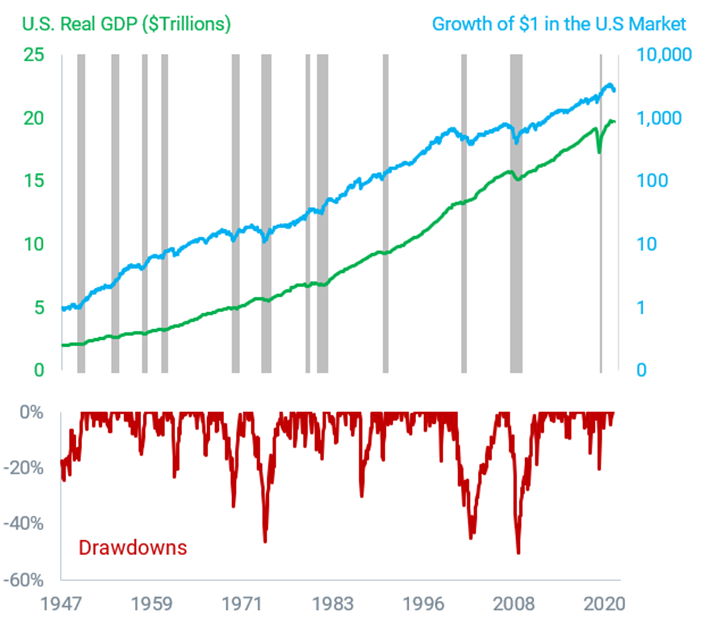
While it is normal to look for insights from historical periods that seem similar to what we face today, we do not want to lose sight of the bigger picture. In Figure 4, we plot U.S. real GDP, which accounts for the effects of inflation to make different periods comparable, and the growth of $1 invested in the U.S. stock market from 1947 through 2021. 

Figure 4 | The Economy and Stock Market Have Overcome Many Rough Periods Throughout History

Figure 4 | The Economy and Stock Market Have Overcome Many Rough Periods Throughout History

Figure 4 also shows drawdowns for U.S. stocks over time, which is the negative performance from the market’s previous peak. This shows that, while the long-term growth of wealth line appears smooth, if we magnify periods of decline, we can see that the experience for investors is not always so smooth. 

Over the long term, the U.S. economy has overcome many recessions, shown as shaded periods in Figure 4, and despite these short-term bumps along the way, has time and again recovered and experienced tremendous growth in GDP. 

U.S. stocks have also been a powerful driver of long-term growth despite market drawdowns. The long-term results demonstrate that investors who have stuck with stocks through the tough times have historically been rewarded.

Market downturns are like traffic lights. When we drive, we may be slowed by red lights, but that doesn’t prevent us from proceeding to our destination. If we choose not to drive to avoid being stopped at red lights, we can’t get to where we want to go. 

Similarly, if we stay out of the market to avoid downturns, we may not reach our financial goals. So, it’s important to practice patience and learn to manage in times of uncertainty. Keeping a focus on the long-term destination can help.


Rx Wealth Advisors is a physician-focused financial advisory firm. Their primary focus is to help medical doctors maximize their earnings, keep more money in their pocket, and cultivate wealth so they can live the life they’ve earned and deserve. Rx Wealth can be reached at 412-227-9007, via email at croe@rxwealthadvisors.com, or on the web at rxwealthadvisors.com.

  1. Discount rate: The rate used to reflect the time value of money and calculate the present value of a future stream of expected cash flows in a discounted cash flow (DCF) analysis. 

This material was prepared by Avantis Investors, and does not necessarily represent the views of the presenting party, nor their affiliates. This information has been derived from sources believed to be accurate and is intended merely for educational purposes, not as advice.

Data from 1973 – 2021. The market is represented by the CRSP U.S. Total Market Index. Source: Avantis Investors. The average number of months over the period from Peak to Trough is 10.7 and from Trough to Peak is 71.9. Past performance is no guarantee of future results. The average number of months over the period from Peak to ½-Trough and ½-Trough to Trough is 5.4, while the number of months over the period from Trough to ½-Peak and ½-Peak to Peak is 35.9. Small value stocks are represented by the Small Value Portfolio from Ken French’s Data Library. U.S. real GDP data from Federal Reserve Economic Data (FRED). The opinions voiced in this material are for general information only and are not intended to provide specific advice or recommendations for any individual.

Open Q&A for Physicians & Healthcare Professionals

November 23, 2022 by crystal

Chris recently hosted an “Ask Me Anything” open Q&A webinar for physicians and healthcare professionals. In it, he answered questions that participants brought to the meeting, such as:

  • Should I contribute to my Roth 403(b) or should I contribute to a tax-deductible 403(b)?
  • What should I be doing from a tax planning perspective if I am simply employed by a hospital?
  • How do I know how much I need to save for retirement?
  • Given that this has been a rough year, what should I be doing with my investment portfolio and how can I combat inflation?

Watch the recording here:


Is Your IRA Creditor Protected?

October 1, 2022 by crystal

Physicians, like anyone else, commonly get personal and business loans. As part of getting a loan, a promissory note and security agreement are usually included and signed with little review or thought. Unfortunately, in signing these documents, it’s possible for your IRA assets to be inadvertently pledged as part of the transaction.

The ruling in the Florida case, Kearney Construction Company, LLC v. Travelers Casualty and Surety Company of America, held that a debtor’s personal IRA, which is normally protected from creditors, was no longer protected because it was pledged when the IRA owner signed a blanket security agreement granting the lender a security interest in all the debtor’s accounts. Mr. Kearney had executed a promissory note and signed the blanket statement before filing for bankruptcy.

The UCC-1, a standard security agreement lenders file to record their security interest in assets, had generic blanket collateral language and granted the lender a security interest in “all assets and rights of the pledgor.” Because of this, the court says it was enough to grant a valid security interest in an IRA.

Since giving a security interest in an IRA is considered a prohibited transaction for tax purposes, the result is disastrous on two fronts. One, a pledged IRA is deemed immediately terminated, and a taxable distribution occurs; and two, the IRA loses its tax-exempt status and is no longer qualified as a creditor-exempt asset under Florida law.

While many believe this case was wrongfully decided and the Florida legislature is actively trying to fix it, we need to be aware of this decision in planning any current and future financing transactions. A few simple moves and awareness can prevent you from being in a bad situation like Mr. Kearney.

To avoid this situation, any pledge agreement signed going forward should be clear that retirement accounts and other creditor-protected assets are not pledged. The next question becomes, where does this leave debtors who executed blanket pledges in the past?

This now leaves physicians in Florida and perhaps other states who have signed these blanket pledge statements (which includes anyone who has a mortgage, credit card, or other loans) in a state of flux, questioning if their IRAs have lost their tax-exempt status and are no longer creditor protected.

So, what can be done to correct the past? Here are a few untested suggestions:

  • Renegotiate the security agreement with the lender to provide clarity. This should be done with great care.
  • Refinance the debt and negotiate a new security pledge agreement to provide clarity on the IRA and other creditor-protected assets.
  • Rollover your existing IRA to an ERISA-Sponsored Plan (i.e., 401(K)) 
  • Set up a new IRA and roll over the existing IRA. It is unclear how the new IRA is treated from a creditor protection standpoint since funded with a possibly tainted IRA. 
  • Use your IRA to purchase creditor-protected assets. 
  • Do a Roth conversion.
  • Do a lifestyle withdrawal from your IRA. This will allow you to place new earned income into other creditor-protected vehicles.

Before implementing any strategy, please consult an attorney or tax advisor. While we wait to see if legislation fixes the issue, any security agreement should be closely reviewed by legal counsel and provide for language to exclude any tax-advantaged assets. Going forward, pledging assets should be done with great care. If not, you may end up losing your IRA and incurring a large tax bill.


Rx Wealth Advisors is a physician-focused financial advisory firm. Their primary focus is to help medical doctors maximize their earnings, keep more money in their pocket, and cultivate wealth so they can live the life they’ve earned and deserve. Rx Wealth can be reached at 412-227-9007, via email at croe@rxwealthadvisors.com, or on the web at rxwealthadvisors.com.

The situations or opinions mentioned in this article are for general information only and are not intended to provide specific advice or recommendations for any individual. To determine which investments or strategies may be appropriate for you, consult your financial advisor prior to investing. 
Advice for Physicians: Should You Prioritize Investing or Paying Off Debt

January 3, 2022 by eric

It’s not uncommon for physicians to carry loads of debt. From student loans to business startup costs, it’s expensive to become a doctor and run your own practice. Realizing the full return on your investment often takes time. So if you are struggling to decide whether to focus on paying debt down aggressively or investing more money for the future, you’re not alone.

You can choose one of two divergent paths, both of which have their merits. Prioritizing debt payments over investing allows you to become debt-free quicker. On the other hand, making minimum debt payments frees funds to invest in a market where opportunities are volatile, but earnings may exceed the cost of your debt. Alternatively, there is an approach that takes the middle ground: pay down some of the debt quicker and have some money left over for investing.

The below illustrates three alternatives with hypothetical examples. First, let’s explore strategies for prioritizing debt payment.

Strategies for Paying off Debt for Physicians

Most people are happier being debt-free. It provides both emotional relief and a sense of security. Research shows a direct relationship between debt and psychological well-being. (1) However, it’s important to note a person’s attitude toward debt also depends on the nature of indebtedness. For example, individuals have more debt tolerance for a $500,000 home mortgage than for $20,000 in credit card debt. The mortgage is on an asset that should be growing in value and is held at a lower interest rate, while the credit card debt is generally held at a relatively high interest rate and the funds are less likely to be leveraged. 

While various strategies for prioritizing debt payments exist, Trent Hamm writing for The Simple Dollar describes three approaches to consider in becoming debt-free. (2)

1. Pay off loans by lowest to highest balance.

Author and radio show host Dave Ramsey calls this the “debt snowball” strategy. The idea is to get a quick psychological win by paying off the lower debt amounts. Ramsey points out that these wins can create motivation that becomes life-changing start to becoming debt-free.

2. Pay off loans by highest to lowest interest rate

For this strategy, you make the minimum payment on all debts, but make a higher payment on the highest interest debt. This can be a better approach mathematically in terms of saving interest rate costs. The drawback is that your highest interest debt could be the largest debt amount. It could take a longer time to pay that debt down and you will have to delay the aforementioned psychological win.

3. Pay off credit cards first

This approach recognizes that lower credit card balances improve your credit score. It’s about credit utilization—or the percentage of what you owe against the credit limit of the card —the lower the percentage, the more positive impact on the credit score.

When Physicians Should Prioritize Investment Over Debt Payment

An anesthesiologist and blogger at Another Second Opinion offer an interesting perspective on investing by describing three strategies specifically for physicians, using examples of three hypothetical young doctors. The author made some assumptions (and did the math accordingly): (3)

  • Each doctor carried $100,000 student loan debt with a 4 percent interest rate (with a monthly payment of nearly $2,000)
  • Their incomes were too high to deduct the loan interest from their income taxes
  • Each had a stable income and could stick to their plan
  • Market gains continued at an average rate of 8 percent
  • Inflation and dividend taxes were negligible because of tax sheltering, etc
  • Investments were not tax-deferred (Note: factoring in tax benefits when investing pre-tax dollars could skew the outcome in favor of investing vs. debt pay down)

Doctor #1 prioritized paying off debts. She paid off the student loan in three years and began investing $3,000 every month thereafter. After 10 years, Doctor #1 is debt-free and accrues an investment amount of $334,976.84.

Doctor #2 paid only the minimum toward his debt and invested the remainder. After 10 years, Doctor #2 is likewise debt-free and has an investment account worth $360,209.42.

Doctor #3 employed a combination of tactics. She paid a little more than the minimum on her student loans and invested at the same time. Her student loan was paid up in 4.5 years. After 10 years, her investment net worth is $345,529.58.

So, our anesthesiologist blogger did the math and showed how risk-taker Doctor #2 came out ahead. Doctor #3 hedged her bets and saved some interest payments on her student loan, but earned slightly less. Doctor #1 settled for the lower return, but went for the positive psychological payoff of being debt-free quicker.

Because physicians are high earners, you can avoid falling into the trap of ballooning student debt, which lower earners find themselves in when they choose income-based reduced payment plans. When you hear stories about student loan borrowers owing more than they started with a decade after graduation, this is why. Your investment in education is paying off at a better pace. 

There is no single answer to solve the riddle of investing versus paying off debt. Each physician’s personal situation is unique, and the right approach for one physician may not be right for another.

Should you want to discuss your particular situation and what approach is right for you, we are here to help.

Sources

(1) https://www.sciencedirect.com/science/article/abs/pii/S0167487005000103

(2) https://www.thesimpledollar.com/in-what-order-should-i-pay-off-my-debts/

(3) http://www.anothersecondopinion.com


Copyright 2021 All Rights Reserved. This content is developed from sources believed to be providing accurate information, and provided by Rx Wealth Advisors, LLC for general informational purposes only. It may not be used for the purpose of avoiding any federal tax penalties and in no way is meant to provide specific tax, legal or financial advice. Please consult legal or tax professionals for specific information regarding your individual situation. The opinions expressed and material provided are for general information, and should not be considered a solicitation for the purchase or sale of any security.


7 Cardinal Sins of Investing – Are You Committing Any of These?

June 23, 2020 by eric

By: Chris J. Roe, CPA/PFS

Have you ever heard a financial advisor or money manager tell you their investment portfolio beats the market? How about them forecasting where the markets or economy will be in the next year?

It happens all the time. But here’s the thing. Great financial advisors do not guess or give investment opinions. Nor do they believe they can predict the future .

If you’re working with a financial advisor, or managing your money all on your own, you want to watch out for a few common pitfalls. At Rx Wealth, we call them the 7 “sins” of investing.

Sin #1: Gossip

If you try to time the market based on what you hear on TV, radio, or from your colleague or neighbor, you’re in for it. Remember, what you hear is just an opinion—and not necessarily a fact. Great financial advisors don’t employ opinions. Instead, they rely on financial science to manage wealth. For example, we know, based on years of academic research, stocks have a higher expected return than bonds and that certain characteristics, such stock size, price and earnings, tend to dictate their returns over time. As for bonds, their returns are determined by the credit quality and term (i.e., 1 year till you get paid back or 30 years till you get paid back). By considering how much stocks and bonds to hold and what types, we can more easily build a strategy that supports your investment goals.

Sin #2: Applying misinformation

Some financial advisors purposely obscure financial terms and systems. Why? So, their clients don’t have true control of their wealth. Then they sell them high-cost solutions. It’s just not right. Make sure you truly understand what your financial advisor is telling you. Ask as many questions as possible. For instance, when an advisors says he/she can build a custom portfolio just for you, you should ask them to show you academic proof that their “custom” portfolio will provide better long-term performance than say a “model” portfolio. We fully expect them to show you it will, without academic proof. But remember, they are showing you history and past performance not the future. No one can predict the future. We can easily tell you the past Super Bowl winners, but who will win next year? Would you hire us if we got history wrong? Remember, you are not hiring a financial advisor based on them showing you history, you are hiring them based on who you feel you can easily relate to and who can work with you to develop a strategy based on solid, time-tested academic research and financial principles that places you in the best position to excel in the future.

Sin #3: Envy

Making investments or investment decisions based on what your neighbors or colleagues say isn’t smart. Generally, people only tell you when they’re doing well—not when they’re losing money. Take what people say with a “grain of salt”. A better strategy is to base your investment decisions on years of academic research and solid fundamental investing principles, while keeping in mind that your discipline to saving money and your emotional decision making in good and bad times may ultimately determine your success.

Sin #4: Pride

Be on the lookout for a financial advisor that seems prideful. Don’t believe claims that an advisor can beat the market or build a better portfolio that will achieve a greater return. It’s not always true. A trustworthy financial advisor will use long standing research and time-tested strategies to give you the best chance for success over a long period. Always remember that past performance is no guarantee of future results.

Sin #5: Vanity

If you find yourself chasing past performance because you believe it determines future results, beware. When it comes to investing, returns are predominantly determined by a.) the amounts of stocks versus bonds you own, b.) the types of stocks and bonds you own, c.) your portfolio costs and taxes; and d.) most importantly, your behavior in good and bad markets. Refer to Sin #2.

Sin #6: Sloth

It’s incredibly important to keep reviewing your portfolio for new, hidden opportunities. Make sure you work with a financial advisor who is proactive. The best advisors can reduce overall portfolio costs, rebalance from stronger investment performers to weaker investment performers, all while looking for opportunities to take tax losses and minimizing tax events in an effort to enhance after-tax returns. Remember, you can spend what you make after taxes, not what you make before taxes.

Sin #7: Greed

When the markets are up, a lot of investors lose sight of the risk they are taking. Instead, they get greedy and focus on competing with colleagues or neighbors who say they are making more. Remember, the most important thing is to meet your financial goals—not make more money than other people.

At Rx Wealth, we understand investment markets are efficient and extremely difficult to beat over time. And, they’re almost impossible to beat after factoring in investment costs and taxes. Based on these factors, we developed the Rx Wealth Investment Philosophy.

Money is different from wealth. At Rx Wealth, we believe money is an account balance, but wealth is a way of life. It’s a standard for living, and one that, with the right decisions, can be achieved and maintained. We consistently strive to help our clients avoid the 7 sins to achieve greater wealth.

If you want to chat further about how you avoid these investment sins, please reach out to us for a complimentary consultation.

Disclaimer:

2020 All Rights Reserved. This content is developed from sources believed to be providing accurate information, and provided by Rx Wealth Advisors, LLC for general informational purposes only. It may not be used for the purpose of avoiding any federal tax penalties and in no way is meant to provide specific tax, legal or financial advice. Please consult legal, financial or tax professionals for specific information regarding your individual situation. The opinions expressed and material provided are for general information, and should not be considered a solicitation for the purchase or sale of any financial advice or investment security.

  • Go to page 1
  • Go to page 2
  • Go to Next Page »

Footer

Sign up to receive insights, resources, and tips straight to your inbox!

Name(Required)

Contact Us

5020 Carnoustie Drive
Presto, PA 15142

Email Us
412-227-9007
855-824-7471

Schedule a Complimentary Consult

Rx Wealth Advisors, LLC’s (“Rx Wealth”) website, including downloading, printing or storing any website content, is exclusively for Rx Wealth Advisors, LLC’s clients and potential clients. Any reproducing or editing by any means, mechanical or electronic, in whole or in part, without the express written permission of Rx Wealth is strictly prohibited and subject to prosecution under U.S. and International copyright and trademark laws.

As a preceding condition to accessing Rx Wealth’s website, each client, prospective client or unaffiliated third-party agrees to release and forever hold harmless Rx Wealth and its related persons, including its officers, directors, owner, employees and agents, from any and all adverse consequences resulting from any actions taken by the website user and/or omissions which are not related to receiving Rx Wealth’s individual counsel.

Copyright © 2023 RX Wealth Advisors

ADV | Terms of Use | Schedule a Meeting | Privacy Policy